Plots from the ICSD using ElMD
Click images to follow through to interactive plots
The ICSD with respect to ElMD (UMAP)
Here we see the complete ICSD, coloured by standard deviation of the electronegativity (ionicity) of the compound.

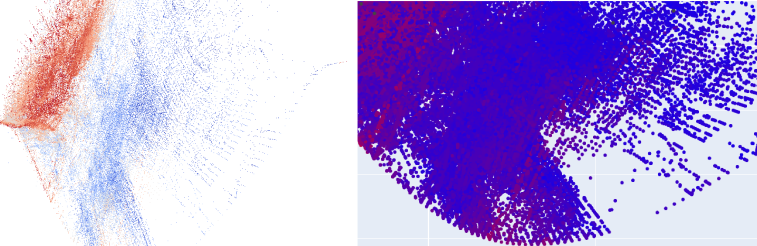
The ICSD with respect to ElMD (PCA)
Again we see the ICSD coloured by the ionicity, but instead reduced using PCA, where the parallel trends can more clearly be seen.
The Binary Compositions Reduced with respect to Modified Pettifor Number
Here we see 12, 623 binary compounds from the ICSD, labelled according to their region of the periodic table
